Last Updated on October 7, 2026 by Kravelv Spiegel
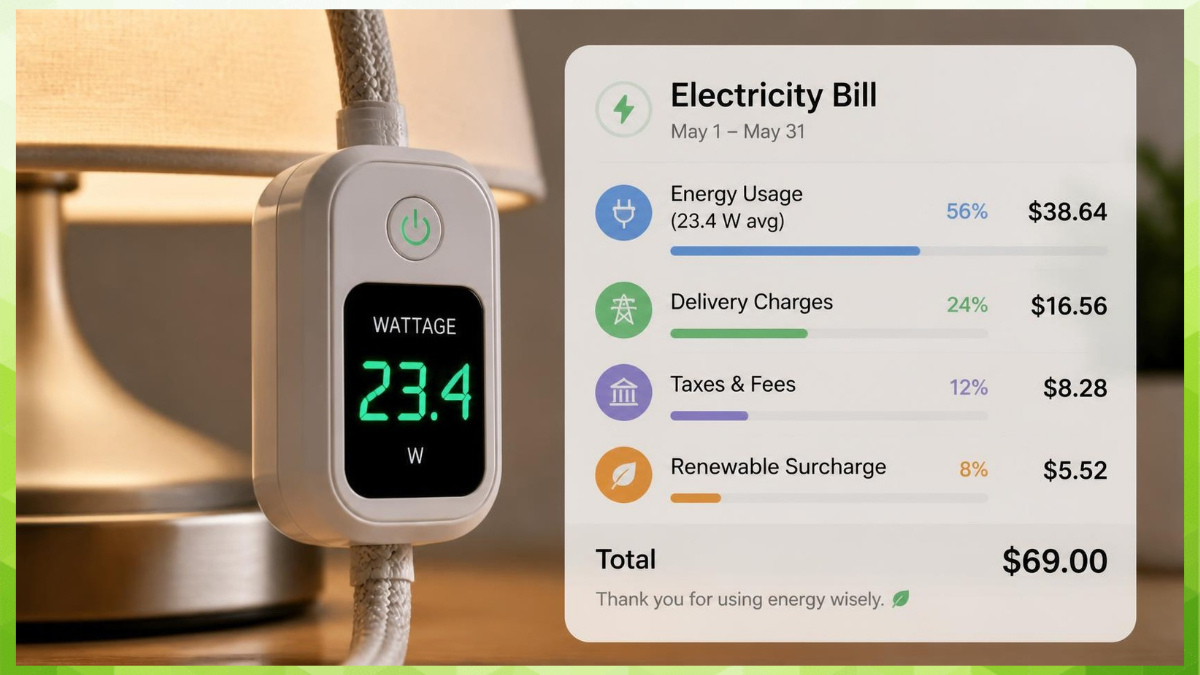
Smart plug data helps you read your electricity bill by letting you match the kilowatt-hours (kWh) a specific device used against the rate your utility charges per kWh, turning an abstract total into a concrete, device-by-device breakdown. Your bill itself is made up of a few core parts: your total kWh usage, a supply or generation charge, a delivery or distribution charge, and various fixed fees and taxes. A smart plug reports real-time wattage and cumulative kWh for whatever is plugged into it, which you can multiply by your bill’s per-kWh rate to estimate that device’s actual dollar cost. This turns a confusing monthly total into specific numbers you can act on.
Why This Matters
Most electricity bills list a single total without explaining which appliances or habits actually drove that number up, which makes it nearly impossible to know where to cut back if costs rise unexpectedly. A nationally representative survey found that roughly a third of Americans find their electric bill somewhat or very difficult to read, and smart plug data offers a practical way to make sense of it without needing a background in utility billing. Anyone trying to lower a specific bill, track down an unusually high month, or simply understand where their money goes can benefit from pairing bill literacy with real device-level data.
This guide walks through what each part of a typical electricity bill actually means, then shows how to use data from a smart plug to translate that bill into real numbers for individual appliances. By the end, you will be able to look at your bill and your smart plug app side by side and understand exactly what is driving your costs.
What Are the Main Parts of an Electricity Bill?
A typical electricity bill is made up of your total kWh usage, a supply charge for the electricity itself, a delivery charge for getting it to your home, and various fixed fees and taxes layered on top.
Supply charges, sometimes called generation charges, cover the actual cost of producing the electricity you used and typically account for roughly half to two-thirds of a residential bill. Delivery charges, also labeled distribution or transmission charges depending on your utility, cover the cost of the infrastructure, poles, wires, transformers, and substations, that actually gets electricity to your home, and these charges are generally more stable than supply rates but have been rising due to grid maintenance and storm-related repairs. On top of both, most bills include a fixed monthly customer charge regardless of usage, along with regulatory fees and taxes that vary by state and utility.
Some utilities also use tiered rate structures, where your per-kWh rate increases once usage crosses a certain threshold within the billing period, which means the same device can cost more per kWh in a high-usage month than in a low-usage one.
Core components of a typical bill:
- Total kWh usage for the billing period
- Supply or generation charge (cost of producing the electricity)
- Delivery or distribution charge (cost of transporting it to your home)
- Fixed monthly customer charge
- Taxes and regulatory fees
- Tiered rate thresholds, if your utility uses them
How Does Smart Plug Data Relate to Your Electricity Bill?
Smart plug data shows you the real-time wattage and cumulative kWh used by one specific device, which you can compare directly against the total kWh and rate listed on your bill to understand where that usage is actually coming from.
Your bill reports one combined number for everything running in your home over a full billing cycle, which makes it impossible to tell whether a space heater, an old refrigerator, or a home office setup is responsible for an increase. A smart plug narrows that picture down to a single device, tracking its wattage draw in real time and logging cumulative kWh over hours, days, or the full billing period, depending on the app. Lining this device-level data up against your bill’s total usage and per-kWh rate turns an abstract number into something you can actually investigate and act on.
This comparison works best with plugs that log historical kWh data over time, such as the Kasa Smart Plug with Energy Monitoring, rather than models that only display current wattage without storing a usage history.
What smart plug data typically includes:
- Real-time wattage draw for the connected device
- Cumulative kWh used over a selected time period
- Historical usage trends, viewable by day, week, or month on supported models
- Cost estimates in some apps, calculated from a rate you enter manually
How Do You Calculate the Cost of a Device Using Smart Plug Data?
You calculate a device’s actual cost by multiplying the kWh your smart plug recorded for that device by the per-kWh rate shown on your electricity bill, including both the supply and delivery portions of that rate.
Start by finding your effective rate per kWh, which is not always printed as a single number on the bill. Add your supply charge and delivery charge together, then divide by your total kWh usage for that billing period to get your true blended rate, since using only the supply rate will underestimate the real cost. From there, take the kWh figure your smart plug reports for a specific device over the same time period and multiply it by that blended rate to get a realistic dollar estimate for running that device.
For example, if your bill shows a combined rate of $0.17 per kWh and your smart plug logged 45 kWh for a space heater over the month, that heater cost roughly $7.65 to run during that period. Running this calculation for a few different devices quickly reveals which ones are actually worth addressing and which are negligible.
Steps to estimate a device’s real cost:
- Add your supply and delivery charges, then divide by total kWh to find your blended rate
- Check your smart plug app for that device’s kWh usage over the matching time period
- Multiply the device’s kWh by your blended rate
- Repeat for other monitored devices to compare their relative impact
How Can Smart Plug Data Help You Spot Billing Errors or Rate Changes?
Smart plug data helps you spot billing errors or unexpected rate changes by giving you an independent usage estimate you can compare against your bill’s reported total, rather than relying on the bill alone.
If your bill shows a sudden usage spike but your monitored devices show no corresponding increase in their own kWh totals, that mismatch is worth investigating, since it can point to an estimated rather than actual meter reading, or in rare cases, a billing error. Tracking a few always-on devices consistently over several months also makes it easier to notice when your utility’s per-kWh rate itself has changed, since the same device logging the same kWh usage will show a different cost if the rate moved, even though your habits did not change.
This kind of cross-checking will not catch every type of billing issue, since whole-home factors like HVAC systems are rarely monitored by individual smart plugs, but it adds a useful second data point beyond simply trusting the total on the bill.
What Mistakes Do People Make When Comparing Smart Plug Data to Their Bill?
The most common mistakes are using only the supply rate instead of the full blended rate, comparing data from mismatched time periods, and assuming smart plug totals account for devices that are not plugged into a monitored smart plug.
Using just the supply rate printed on the bill, without adding delivery charges and fees, consistently underestimates what a device actually costs to run, sometimes significantly. Comparing a smart plug’s weekly total against a monthly bill, or vice versa, without aligning the exact date ranges, also produces numbers that look inconsistent even when both are technically accurate. Finally, smart plug data only covers what is plugged into a monitored outlet; hardwired appliances like central air conditioning, electric water heaters, and overhead lighting draw power that never shows up in a plug’s reading, so smart plug totals will always be smaller than your home’s full usage, by design rather than by error.
FAQ
No. Smart plugs only track devices plugged into them, while your bill reflects your home’s total usage, including hardwired appliances and systems like HVAC that no plug can monitor. Smart plug data is a useful supplement, not a replacement.
Many smart plug apps use a rate you enter manually, which may only reflect the supply rate rather than your full blended rate including delivery charges and fees. Recalculating using your actual bill’s combined rate usually resolves the mismatch.
Add your total supply and delivery charges together, then divide that sum by your total kWh usage for the billing period. This gives you a single effective rate that reflects everything you are actually paying per kWh.
Yes. If your usage crosses into a higher-priced tier during the billing period, a device running late in the month may cost more per kWh than the same device running earlier, so tiered rates can make exact calculations more complex than a flat rate.
It can give you a rough estimate for monitored devices, but since it does not cover hardwired appliances or account for rate changes, it is better used to compare relative usage between devices than to predict your full bill total.
Usually not. Focusing on your highest-draw or most-used devices, such as space heaters, entertainment centers, or older appliances, typically gives you the most useful insight without the cost of monitoring every single outlet.
Final words
Your electricity bill becomes far easier to understand once you can connect its total dollar figure to specific devices in your home, and smart plug data is one of the most direct ways to make that connection. Calculating your blended rate and matching it against a device’s logged kWh usage turns a confusing monthly total into a number you can actually act on.
Start by identifying your blended rate from your most recent bill, then check a smart plug on your highest-draw device to see what it actually costs to run. If the numbers do not line up with what you expect, that mismatch is often the first clue toward either a billing issue or a habit worth changing.